What is the personal carbon footprint in France?

Now that the consequences of climate change are almost daily, everyone is trying to find out their CO2 emissions. And also to compare themselves to the national average. So what are the figures?
The personal carbon footprint in France: a quarrel about figures!
Among all the estimates that circulate, let's remember three figures from different government departments.
According to the Ministry of Ecological Transition, a French person emits an average of 11 tonnes of CO2 per year.
For ADEME, the average annual emissions of a French person amount to 9 tonnes of CO2.
Finally, for CITEPA, which produces France's annual carbon balance (also known as the SECTEN report) which is transmitted to the international authorities responsible for monitoring France's commitments, the country's emissions are 418.2 million tonnes of CO2 in 2021. As INSEE counts a population of 67,626,396 inhabitants, the average carbon emissions of a French person are therefore 6.18 tonnes of CO2.
One state, three different services, three figures! But what does the Police do? :-)
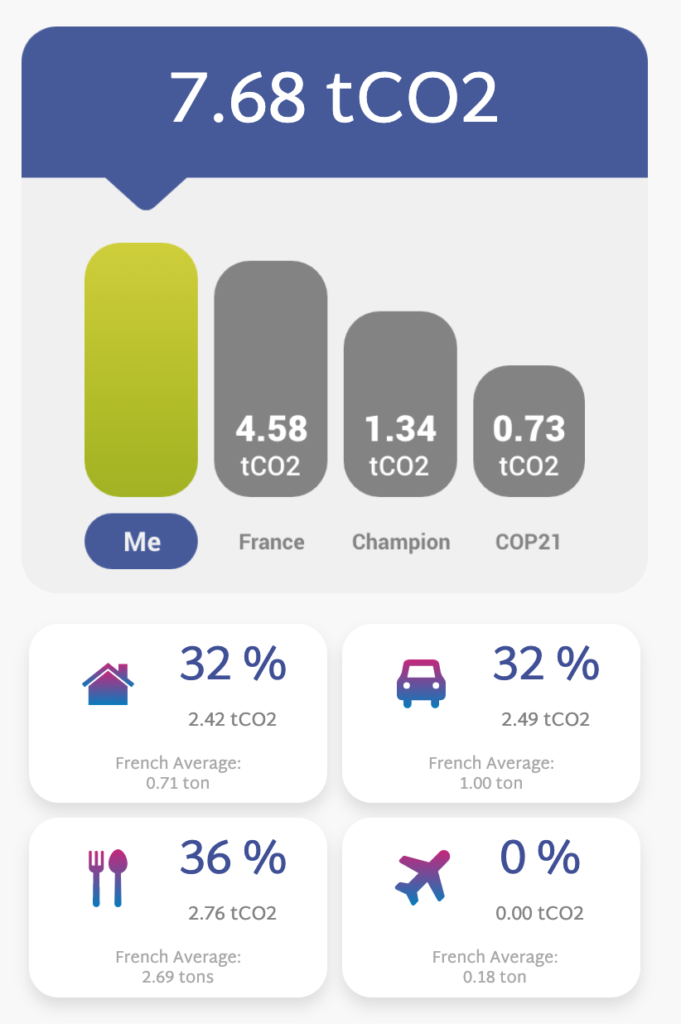
The personal carbon footprint in France is actually equal to 7.68 tons of CO2
This exercise actually illustrates the complexity of carbon accounting, and brings out all its subtleties. While the carbon footprint is always the result of the formula "CO2 emissions = quantity consumed x emission factor", determining the emission factors remains a tricky exercise.
In the same way, when you calculate the emissions from your car, the "amount consumed" is determined by the number of kilometers you have driven. In this example, the emissions from using your car is simple. But who produced your car? In which country? With what materials? If we decide to add the emissions related to the manufacturing and recycling of your car, the calculation becomes more complicated and less accurate (each model, each manufacturer, etc....). This calculation, which includes the emissions linked to the production of the good used, is called the personal ecological footprint. The result is more comprehensive than a simple personal carbon footprint.
Each carbon footprint calculation must therefore specify the assumptions used in the calculation, which is called the calculation methodology. So never forget to consult the methodologies used when you make a calculation of your personal carbon footprint.
Under these conditions, with a methodology that takes into account CITEPA data, which remains the international reference for France, to which we add international air transport emissions, as well as ADEME data for food, we obtain a national average of 7.68 tonnes of CO2/inhabitant corresponding to 519.12 million tonnes for the country divided by 67,626,396 inhabitants.
We can then distinguish between indirect emissions, those on which you have no influence, equal to 3.1 tCO2 per year, and direct emissions concerning those of your home, car and food for a total of 4.58 tCO2 per year.
What are your emissions? Do your own carbon footprint in a minute here!
In which country are personal carbon footprints the highest?
While ADEME focuses on French emissions, data on CO2 emissions per country and per capita can be found at the level of the World Bank or the European Commission.
We will use the data from the World Bank, which gives a personal carbon balance for France of 4.5 tCO2 per year. This level is close to our estimate of direct emissions at 4.58 tCO2/year.
According to the World Bank, the country with the highest per capita CO2 emissions is Qatar, at 32.8 tCO2 per year. Generally speaking, the oil-producing countries in this region are all at the top of the table: Bahrain 22.3 tCO2/year/capita, Kuwait 20.9, United Arab Emirates 20.5, Saudi Arabia 14.6.
Canada 15.4 and the United States of America, unsurprisingly 14.7, are major emitters of CO2.
Russia is at 11.8, while the European Union is at 6.1 tCO2/year on average. However, this hides disparities between countries, with Luxembourg at 15.3 tCO2 per year, compared to only 3.4 for Sweden. While Germany emits 7.9 tCO2/year/inhabitant, Belgium 8.1, Italy is at 5.3, the United Kingdom 5.2 and Spain 5.1.
China stands at 7.6 tCO2 per year.
Finally, it is the poorest countries that emit the least CO2. For example, in Africa, Djibouti and Côte d'Ivoire are at 0.4 tCO2/year/inhabitant, Guinea at 0.3 and Liberia at 0.2.